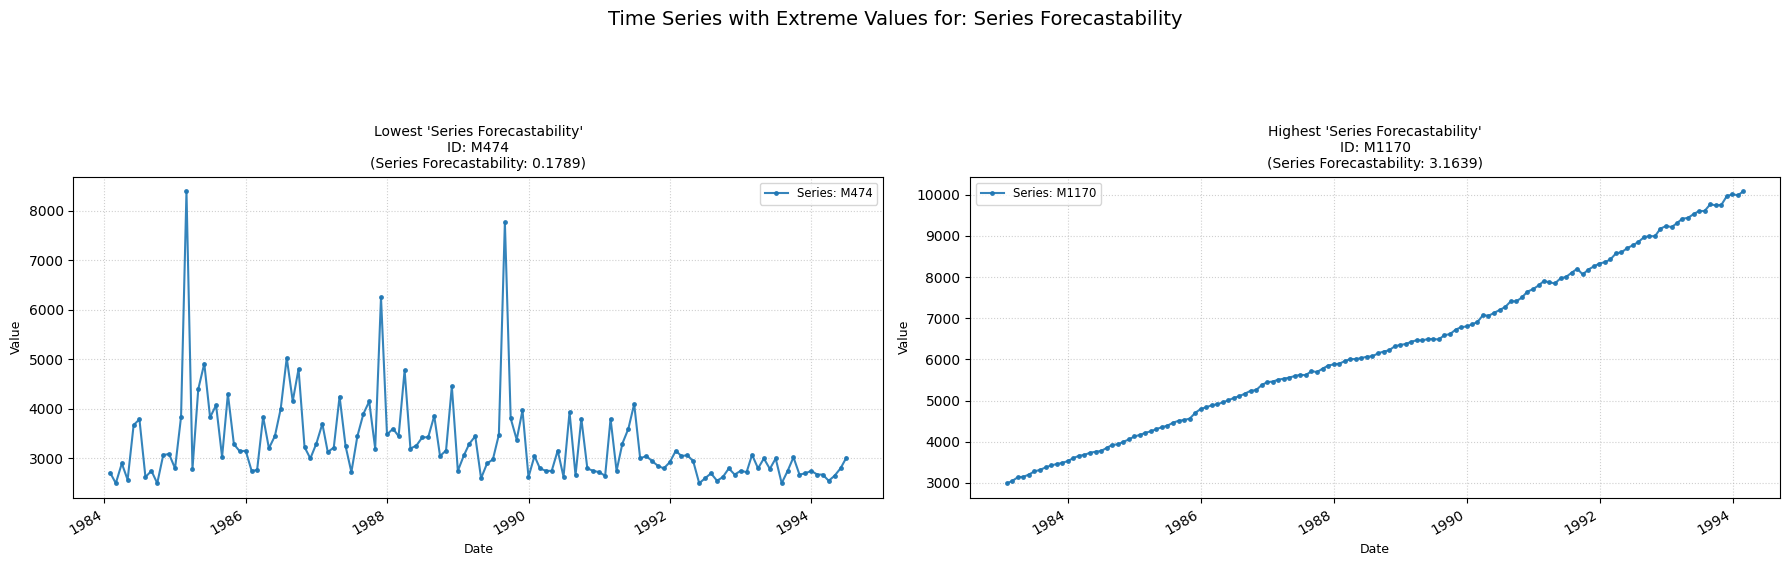
Series Forecastability
forecastability
Measures the forecastibility of a time-series.
Low value: Means there are strong signs of a trend across the time-series.
High value: Means the time-series is probably white-noise.
Parameters Table
| Parameter | Type | Default | Description |
|---|---|---|---|
| sf | float | Mandatory | Sampling frequency. |
| method | str | 'welch' | PSD calculation method ('welch' or 'fft'). |
| nperseg | int or None | None | Segment length for welch method. If None, default based on data length |
| normalize | bool | False | Normalize output to [0, 1] |
Calculation
-
Power Spectral Density (PSD): The PSD of the time series is computed. This is done using the user chosen model. The Welch's method (the default model) uses these formula: o The series is divided into (potentially overlapping) segments. o Each segment is windowed (with a Hann window). o The Fast Fourier Transform (FFT) is computed for each windowed segment. o The squared magnitude of the FFT gives the periodogram for that segment. o The PSD is calculated as the average of these periodograms.
-
Normalization: The PSD is normalized so that it sums to 1, effectively treating it as a probability distribution of power across frequencies.
-
Shannon Entropy: Then the Shannon entropy of this normalized PSD is calculated.
-
Forecastability Value: The computed entropy value is inverted (1/H) and returned.
Practical Usefulness Examples
Inventory Management: For a product with high sales forecastability, a business can maintain lower safety stock. For a product with low forecastability (highly random sales), higher safety stock might be needed to avoid stockouts.
Call Center Staffing: If call arrival rates have high forecastability, staffing levels can be optimized more precisely. Low forecastability might require more flexible staffing or overstaffing to handle unpredictable peaks.