Records Concentration
rec_concentration
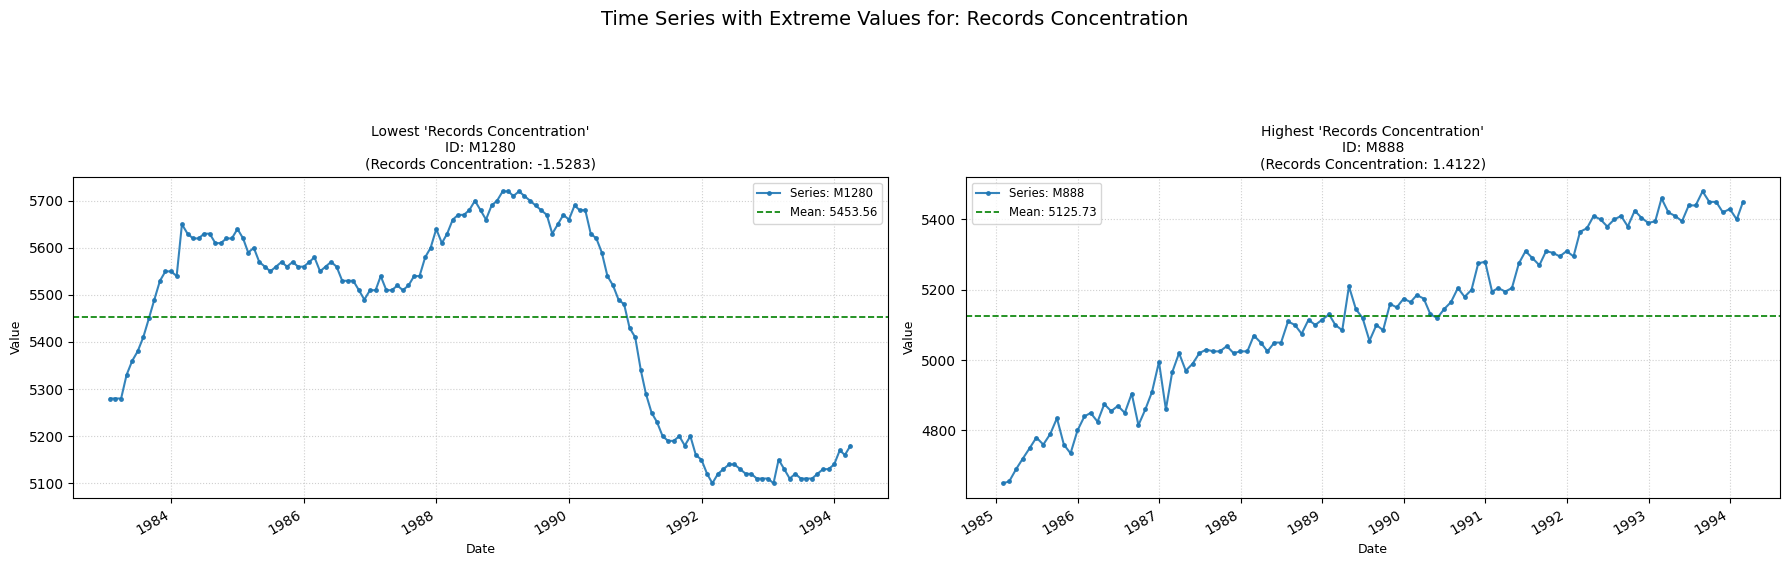
Computes the relative position of the most probable value in relation to the mean.
Low value: Means the most frequent values of the series are concentrated significantly below the mean.
High value: Means the most frequent values of the series are concentrated significantly above the mean.
No Parameters
Calculation
-
Data Range: The minimum and maximum values of the time series are determined.
-
Binning: The calculated range is divided into 10 equal-width bins.
-
Histogram: The number of data points from the time series that fall into each of the 10 bins are counted.
-
Mode Identification: The bin with the highest count (the modal bin) is identified.
-
Feature Value: The returned value is the midpoint (center value) of this modal bin.
Practical Usefulness Examples
Customer Segmentation: While analyzing customer purchase frequency data, this feature might reveal common purchasing patterns (most customers buy 2-3 times a month, for example), helping to segment customers.
Sensor Data Validation: If a sensor typically outputs values concentrated in a specific range, a shift in this feature could indicate a calibration issue or a real change in the measured environment.