Trend Changes
trend_changes
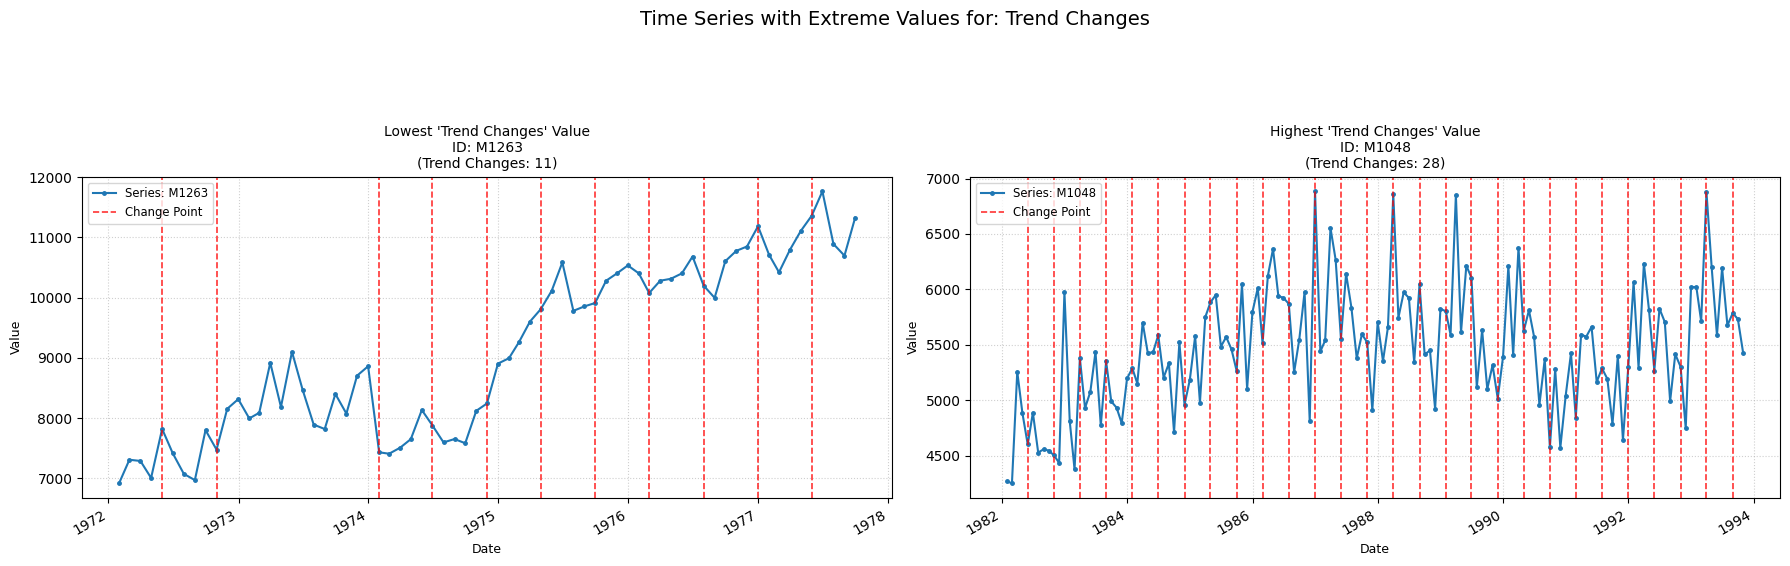
Detects the number of points where the trend changes.
Low value: The trend has few/none shifting points, and is constant through time.
High value: The trend is constantly shifting, provoking many structural changes.
Parameters Table
| Parameter | Type | Default | Description |
|---|---|---|---|
| model | str | 'l2' | Cost function model (e.g., 'l1', 'l2', 'rbf') |
| min_size | int | 2 | Minimum number of samples in a segment. |
| jump | int | 5 | Subsample window for considering change points. |
| params | dict or None | None | Additional parameters dictionary for the cost 'model'. |
| custom_cost | BaseCost or None | None | Custom cost function (overrides 'model'). |
Calculation
-
Pelt Algorithm (Pruned Exact Linear Time): The minimum cost for segmenting the series up to a point t is calculated. This is done by considering all possible previous points s. For each s, the known minimum cost to segment up to s is used, and the cost of the current segment (from s to t-1) is added alongside a penalty term. The minimum cost is then the smallest value found among all these possible s points. This cost is computed iteratively for every point in the series.
-
Breakpoints Counting: The value returned is the number of detected changepoints (breakpoints) found by backtracking through these optimal choices.
Practical Usefulness Examples
Economic Analysis: Identifying when an economic indicator like GDP growth rate or unemployment changes its trend can signal shifts in the economic cycle, informing policy decisions.
Marketing Campaign Analysis: Detecting trend changes in website traffic or conversion rates after launching a marketing campaign can help assess its impact and identify when its effectiveness starts or wanes.