Linear Regression
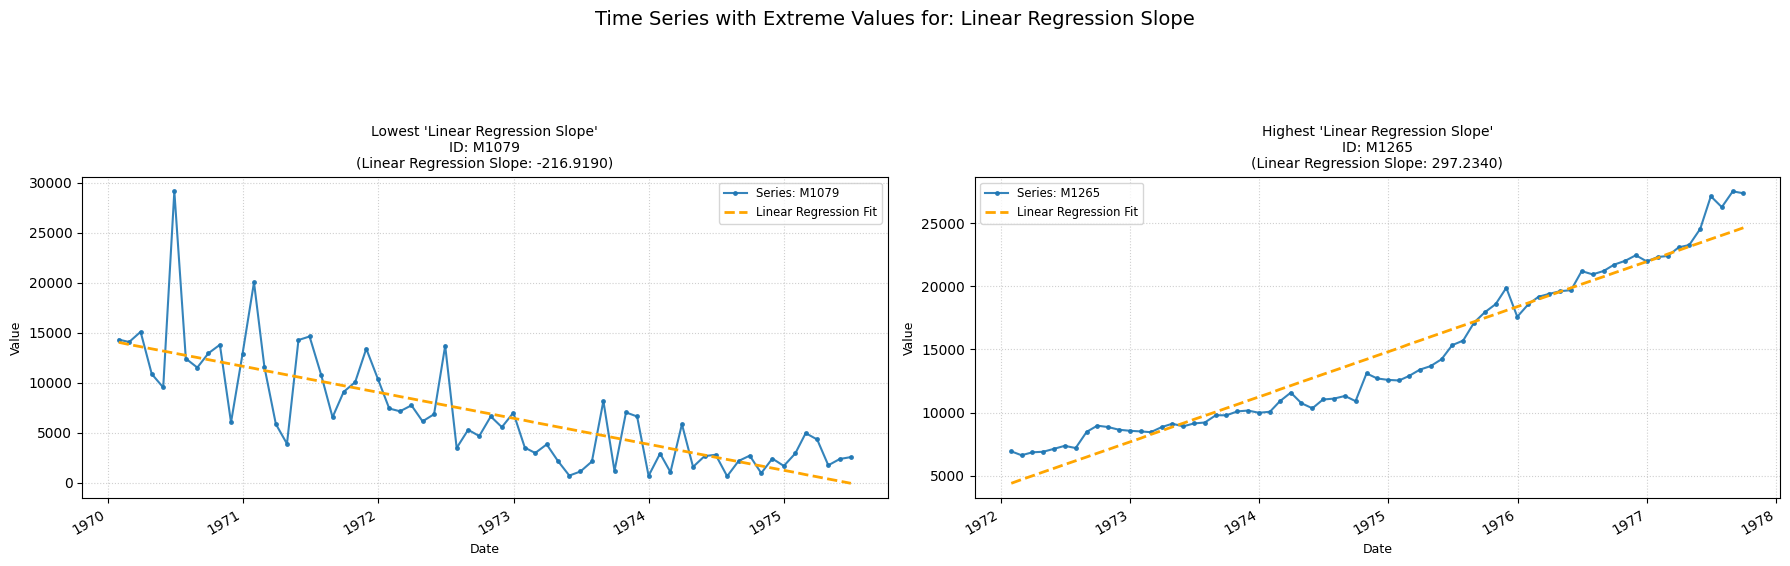
linear_regression_slope
Measures the overall linear trend slope.
Low value: A negative value means there is a downward trend.
High value: A positive value means an upward trend.
No Parameters
Calculation
-
Linear Regression Fitting: First, the linear regression model yi=β0+β1xi is fitted, yielding predicted values yi.
-
Ordinary Least Squares (OLS): Then, the returned value (slope β1) is estimated by minimizing the sum of squared residuals.
Practical Usefulness Examples
Resource Depletion: While analyzing the production data of an oil well, the linear regression slope can estimate the average rate of decline in production per month, helping to forecast its remaining lifespan.
Agricultural Yields: Farmers can use the slope from regressing crop yield against year to understand the average annual increase or decrease in productivity due to factors like soil changes or farming practices.
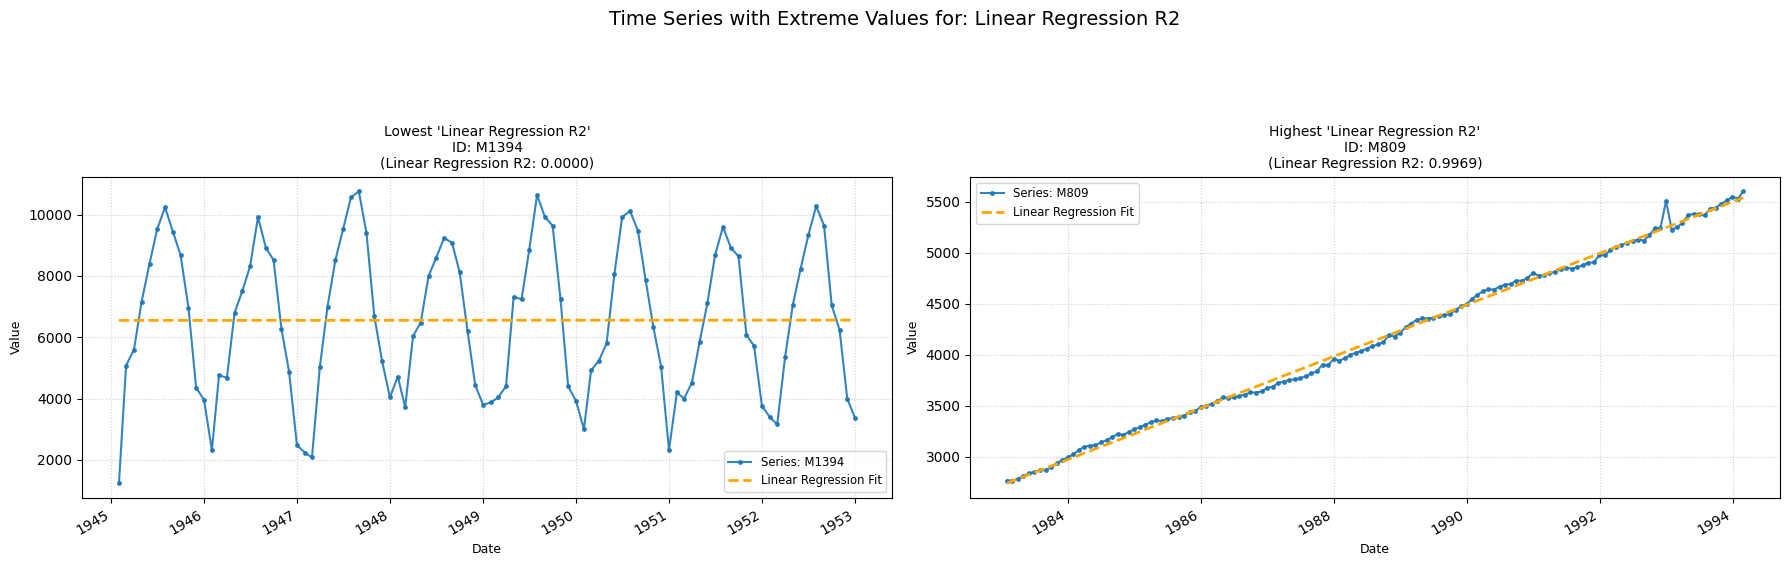
linear_regression_r2
Measures how well a linear trend fits the time-series.
Low value: A value close to zero means a linear model explains little variance.
High value: A value close to one means a linear model explains much of the variance.
No Parameters
Calculation
-
Linear Regression Fitting: First, the linear regression model yi=β0+β1xi is fitted, yielding predicted values y^i.
-
Total Sum of Squares (SST): The total variance in the observed data is then computed as SST.
-
Sum of Squared Residual (SSR): The variance not explained by the model is computed as SSR.
-
R-squared Calculation: The R² value, calculated as R²=1−SST/SSR, is returned.
Practical Usefulness Examples
Software Performance: When analyzing software response time over increasing user load, R² indicates how much of the performance degradation is linearly related to the load. A low R² might suggest other non-linear factors are at play.
Educational Assessment: If tracking student test scores over a semester, R² for a linear fit can show how much of the score improvement is explained by a steady learning trend versus other influences.