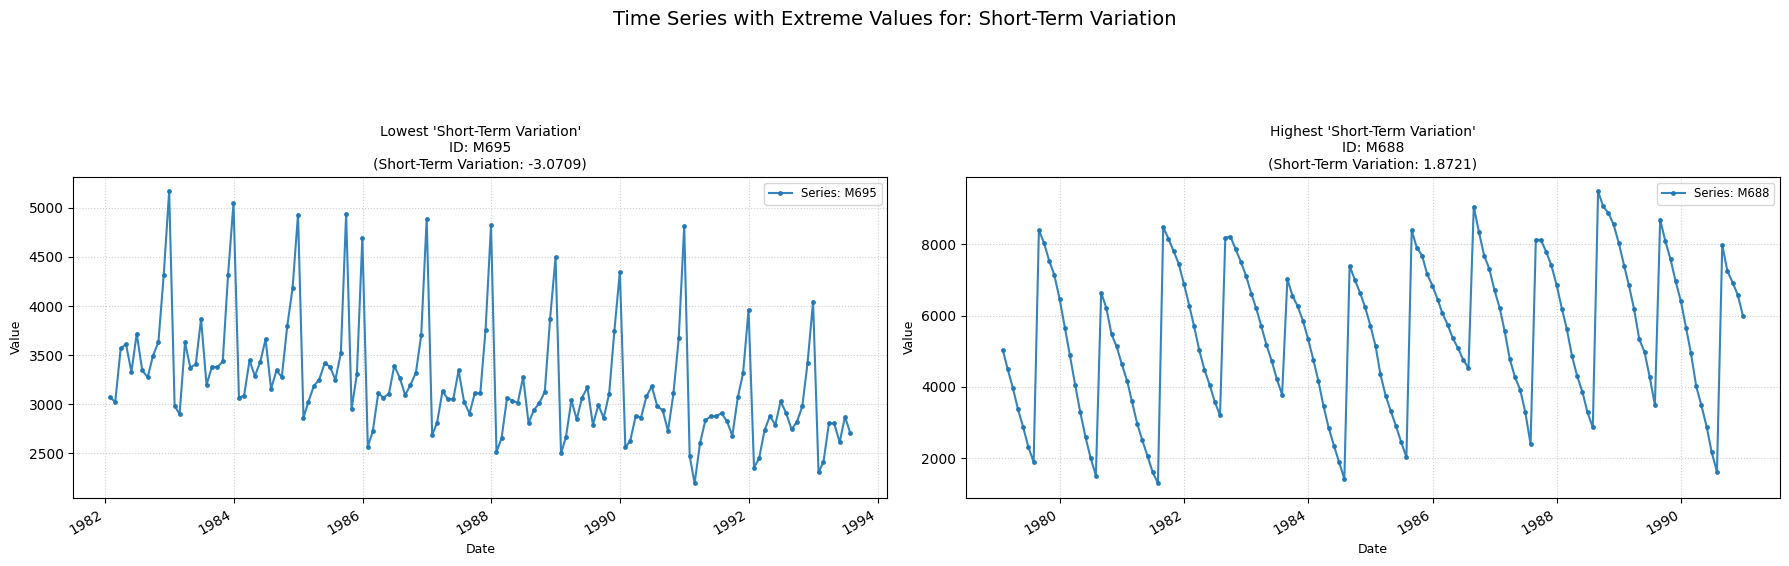
Short-Term Variation
st_variation
Computes the average of the cube of sucessive time-series differences.
Low value: Means the average of the short-term variation across the series is low.
High value: Means the average of the short-term variation across the series is high, indicating a frantic behaviour of the data points.
No Parameters
Calculation
-
Sucessive Differences: Iterate through the time series from the second point to the penultimate point (t=1 to N−1), computing a comparison between each Yt point and its previous Yt-1 point.
-
Final Counting: The number of times Yt > Yt−1 is then counted and returned.
Practical Usefulness Examples
Quality Control: In a manufacturing process, if a product dimension shows low short-term variation, it suggests stability. An increase in reversals might indicate an emerging issue.
Algorithmic Trading: A high number of local upward movements might suggest short-term momentum that a trading algorithm could try to exploit.